EUR/USD Weekly Forecast: Further gains likely above the 200-day SMA
EUR/USD Exchange Rate Forecast
The article forecasts further gains for the EUR/USD exchange rate, particularly if it breaks above the 1.1400 resistance level and remains above its 200-day and 200-week simple moving averages. The ongoing weakness of the US dollar, near three-year lows, is a key contributing factor.
US-China Trade Tensions
The resurgence of trade tensions between the US and China, marked by new tariffs, is creating market volatility and uncertainty. President Trump's policies are a significant factor influencing the global economic climate and the strength of the US dollar.
Central Bank Actions
The Federal Reserve (Fed) maintained interest rates but adopted a cautious stance, hinting at potential rate cuts later in the year due to slower growth and inflation risks. Conversely, the European Central Bank (ECB) lowered its deposit rate and adopted a more dovish tone, suggesting further easing may be on the horizon.
Technical Analysis
Technical indicators suggest a positive outlook for the EUR/USD, with the Relative Strength Index (RSI) near the overbought threshold and the Average Directional Index (ADX) signaling a strong underlying trend. Key resistance and support levels are identified for potential future price movements.
Short-Term Outlook
The article concludes that the EUR/USD exchange rate remains volatile due to ongoing trade tensions and the balancing acts of central banks. Sharp movements are expected in the coming weeks.
- EUR/USD remained close to the area of recent peaks near the 1.1400 barrier.
- The Greenback maintained its offered stance near three-year troughs.
- The ECB left the door open to further easing in the next few months.
EUR/USD maintained its positive footing this week, extending its four‑week bullish run.
While the pair hovered near the key 1.1400 resistance, a decisive break above that level remained elusive. Bolstered by upside momentum, EUR/USD continued trading above both its 200‑day and 200‑week simple moving averages (SMA) at 1.0756 and 1.0840, respectively.
As in recent weeks, this lift coincided with a sharp sell‑off in the US Dollar (USD), which kept the US Dollar Index (DXY) pinned near three‑year lows around the 99.00 support level.
In contrast, Germany’s 10‑year bund yields stayed locked in their multi‑week downtrend, dipping below 2.50% for the first time since early March.
Tariff turmoil keeps markets on edge
Trade tensions remain front and center. President Trump’s sweeping 10% tariff on all US trading partners—escalating to as much as 145% on Chinese imports—has rattled investor nerves.
While a 90-day tariff freeze was offered to countries that choose not to retaliate, and smartphones and computers were exempted from the China list at the last minute, the relief proved short-lived, as tensions rapidly returned to the markets as well as the widespread view that a global trade war is already among us.
Central bank shifts: Cautious Fed, dovish ECB
The Federal Reserve (Fed) held rates steady at 4.25%–4.50% at its March 18–19 meeting, with Chair Jerome Powell adopting a cautious tone. He cited slower growth, persistent tariff‑linked inflation risks, and left the door open for cuts later this year.
In a speech in Chicago this week, Powell pushed back against expectations of immediate rate cuts, underscoring the Fed’s commitment to anchoring inflation expectations and maintaining price stability as the foundation for sustainable employment gains. He also warned of stagflation risks, cautioning that the Fed may face difficult trade‑offs if tariffs deepen and growth diverges from inflation.
Markets now appear to be pricing in roughly 100 basis points of easing by December.
Meanwhile, the European Central Bank (ECB) delivered a widely anticipated 25 bp cut, lowering the deposit rate to 2.25%. In a subtle shift, the policy statement dropped the word “restrictive,” implying that the Governing Council now views policy as neutral.
At her press conference, President Christine Lagarde remained data‑dependent, avoiding forward guidance; however, her tone was more dovish than expected. A unanimous vote, discussion of a possible 50 bp move, and rising concerns over euro strength have markets penciling in another cut as early as June.
Technical setup: Watching key levels
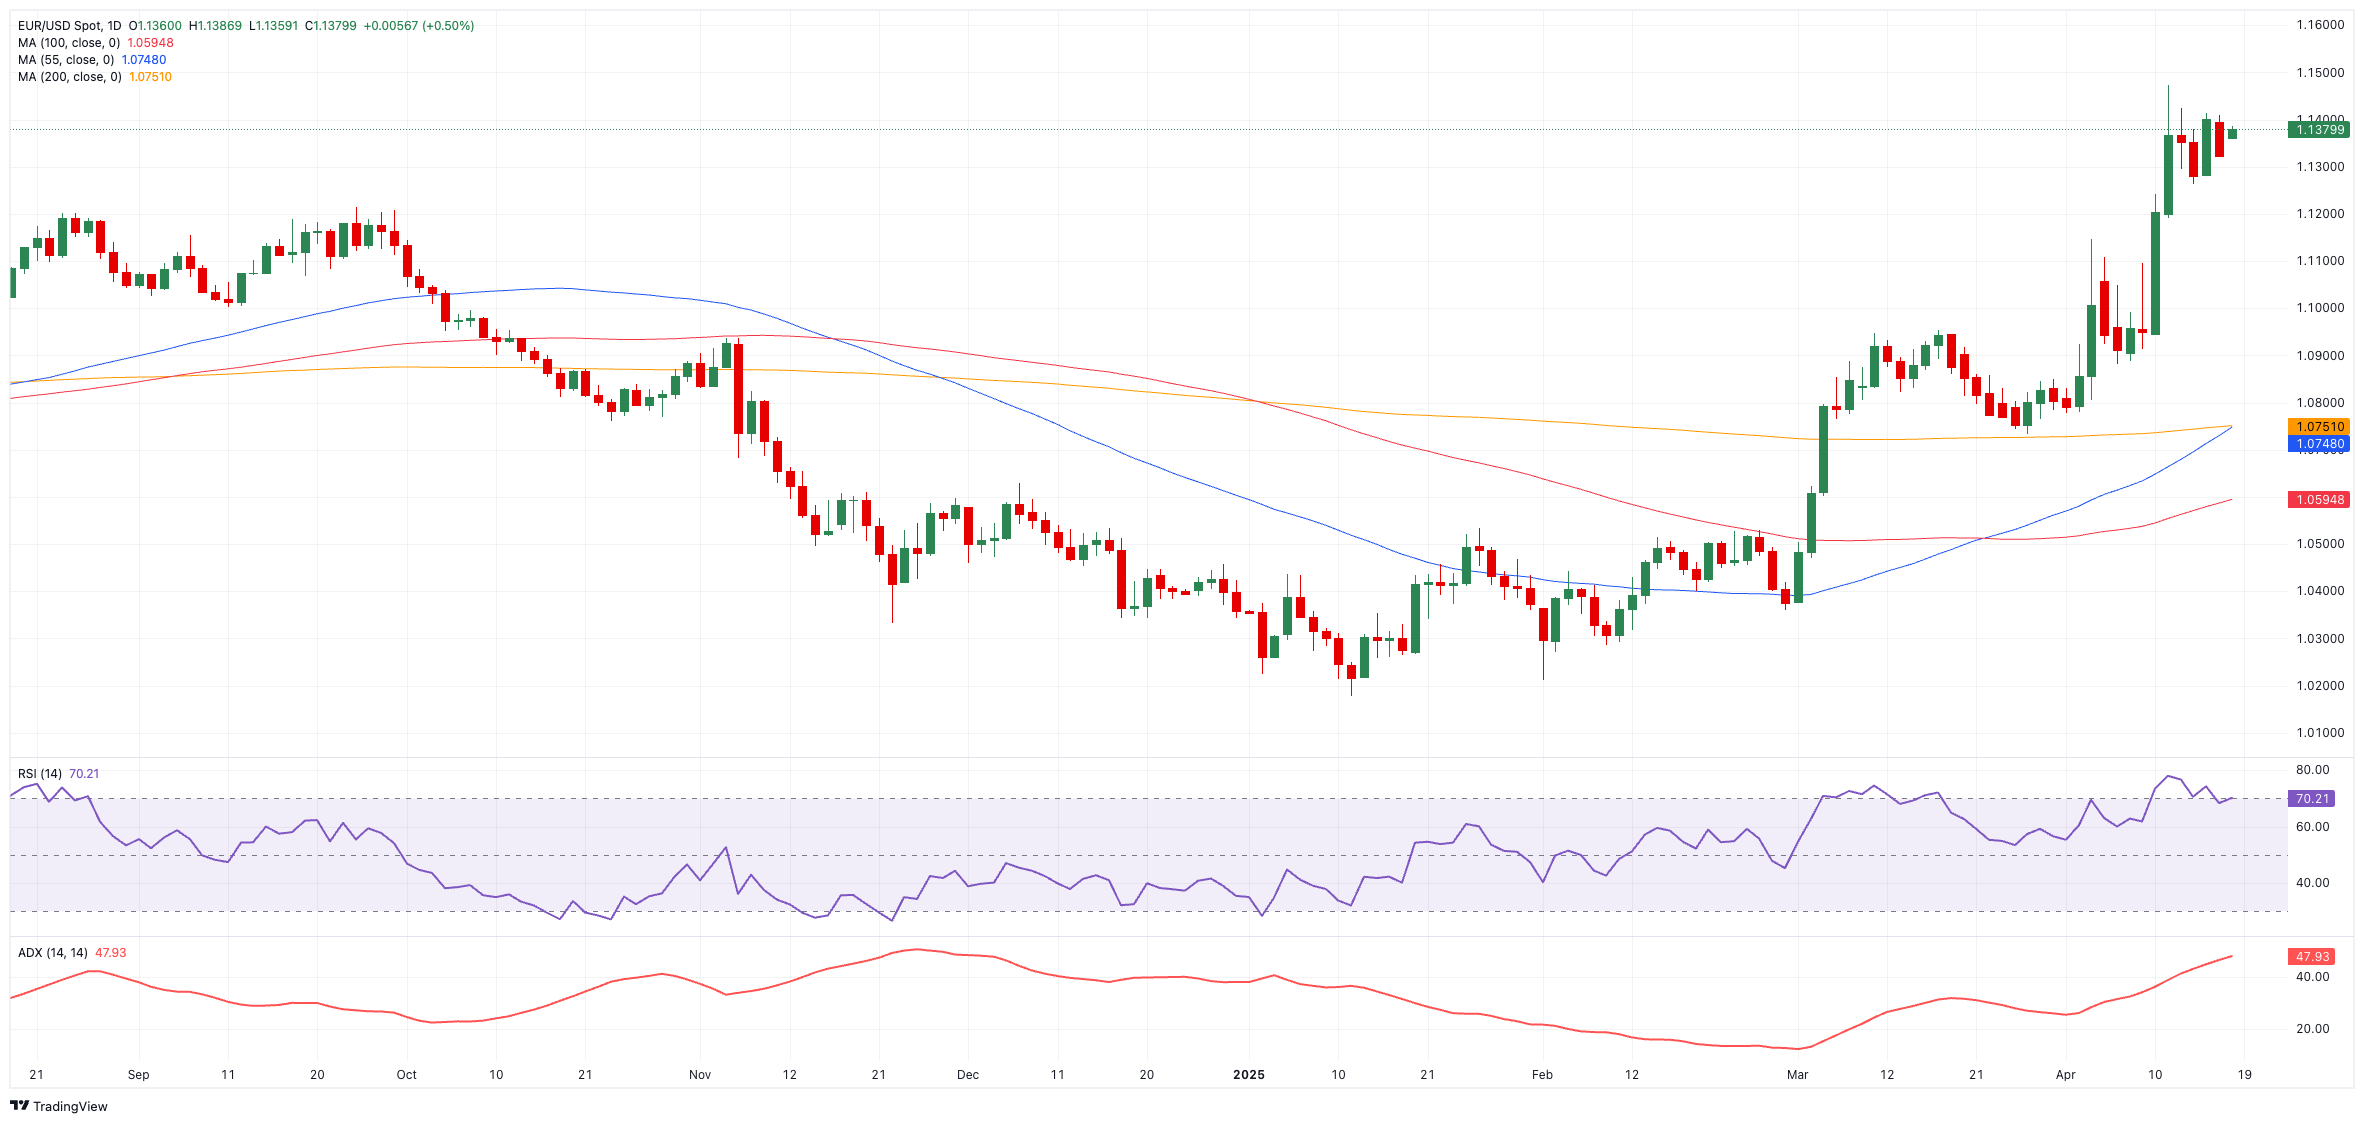
On the charts, resistance looms at 1.1473 (April 11 high), followed by 1.1498 (February 2022 peak) and the key 1.1500 psychological level.
On the other hand, initial support sits at the 200-day SMA at 1.0756, ahead of the March 27 low of 1.0732, which appears propped up by the proximity of the interim 55-day SMA.
Furthermore, momentum indicators show a persistent constructive tone: the Relative Strength Index (RSI) remains close to 71, just above the overbought threshold, while the Average Directional Index (ADX) above 47 still signals a solid underlying trend.
EUR/USD daily chart
Short-term outlook: Volatility ahead
As the US Dollar strength wavers and trade rhetoric intensifies, EUR/USD remains on a knife-edge. Both the Fed and ECB are walking a tightrope, weighing the risks of slowing growth, sticky inflation, and policy missteps. With each new data print or policy signal, expect more sharp moves in the pair—and no shortage of volatility in the weeks ahead.
US-China Trade War FAQs
🧠 Pro Tip
Skip the extension — just come straight here.
We’ve built a fast, permanent tool you can bookmark and use anytime.
Go To Paywall Unblock ToolSave articles to reading lists
and access them on any device
If you found this app useful,
Please consider supporting us.
Thank you!